Video Chart Reviews Tues Nov 17 - In Depth Video. In this video, I'm going to review the $SPY chart first and give my opinion on where I think we will be going in the short term. The pattern I'm seeing now is starting to eerily look like the late 2007, early 2008 chart. I remarked on the public video that I saw various bottom possibilities for a potential right shoulder in a potential head and shoulders (HS) pattern.
Since we built upon the 202 range, I set the titled higher neckline at $202.80, and the lower one at around $199. The $SPY chart closing anywhere in between the above 2 numbers would be a pivot, with $199 being the breakdown level. A close under $199 would almost certainly get us to $180 or min. 10%.. Now, the Fed could choose to reverse repo again to try to stop this, so we should consider this. Nevertheless. I set the new market top higher than my original $207 -- the new high I see is $208 for a potential right shoulder.
Below, I draw the lines to show the potentially emerging pattern. I have a very strong track record at predicting HS patterns as those who have followed me for a long time know:
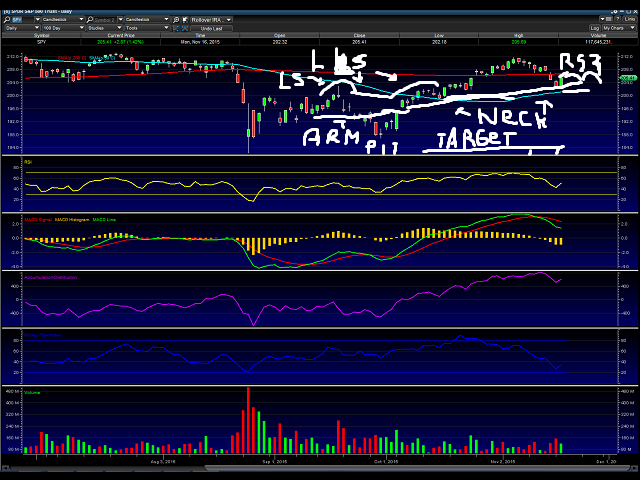
Above, although a bit of a crude drawing, does show what I believe will happen with the $SPY. I marked the left shoulder as "LS." and the potential right shoulder as "RS?" I did say before that if we closed under $204, then we would see $197.50 fast. However, because of the Paris terror attack taking place AFTER the market was closed, this caused the algos to short into limited liquidity, causing a short squeeze and that "bear trap" I was referring to over the weekend. This changes the equation to be more representative of an HS pattern taking shape to eventually get us there.
$SGYP - looking very good, but we need to see a break out very soon. else the wedge will tighten even more. However, 65% of the time with what that chart is showing now, it should bust over $7 IF the market does what I think, so I place a high chance of $SGYP hitting $7 within 5 sessions or less = 70%
$BDSI - Is starting to peel off. We need that one to break out NOW. if not, It will be a good bet the stop levels are reached with that one, which is the $5.20 to $5.35 range. Often times, stop prices end up being areas of support, so keep that in mind if you want to take a little more risk, consider setting stops lower = $5.05.
$CALA is the last chart I review. There is a small gap around $6.20, and if it gets there under decent market conditions, we could see a fast short cover and a move that could reach $7.75 because CALA is a low floater.
$INVE - I give more detail about what's going on there and why without compliance issue resolved, no one will take any action - stock price will be flat at best.
I go over some others here like $CEMP, $MS, $IWM, $IBB and others I give a quick look at, so while video is a bit on the long side, there is good information here.
If you have a biotech you want me to DD, or a stock chart to review, please send an email. If you have sent me it before, please send again to scott@stockmatusow.com
Scott
")