
Video + Chart Illustrations - Charting Tuesday's. Reviewed in video and illustration here are;
$IBB, $SPY, $JUNO, $RLYP, $NWBO, and $BDSI + $GILD and $TWTR brief review and commentary. Video is at the bottom of this page.
$IBB Chart:

The IBB should see a little bounce back today as after hitting the low of around $369.70, it's sufficient to create a potential right shoulder/triangle rise now of a potential head and shoulders pattern. Caution should be taken after a move to $385 as that is the general area a right shoulder could form and begin to dip back down to the near term low. if that low is breached, the last line in the sand would be $360. A close under $360 on volume would likely see a 10% or more correction from $360. Remember, $GILD reports after the bell today. This can have a large effect on the IBB in general. However, I do think GILD will be range bounce in between $108 and $111, so either way I do not think GILD will have as much effect on the IBB as it did in its last earnings.
$SPY Chart:
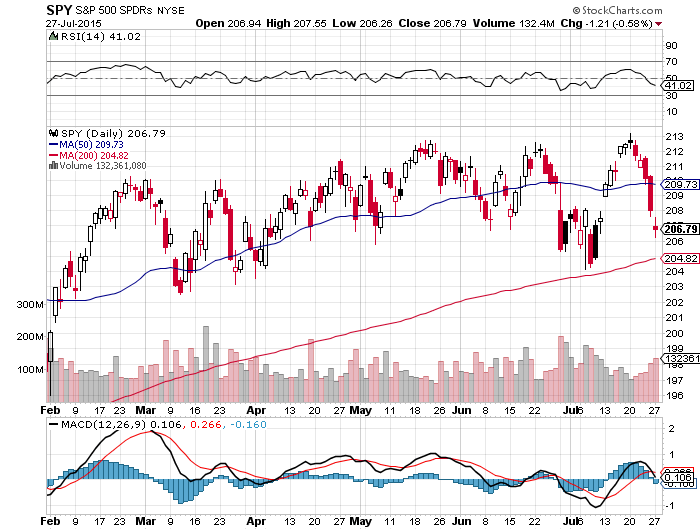
I don't like the $SPY chart although today looks like a bounce back for the time being. This chart reminds me of almost an identical move we saw in 2008 before that market went into the tank. $208.50 to $208.75 is the high pivot/ if we can close substantially over that today. we can pass $210. However, based on the current macro condition, I do think it will be hard pressed to do so.
Additionally, I have added this graphic I saw on CNBC. Do you see the same thing I see?
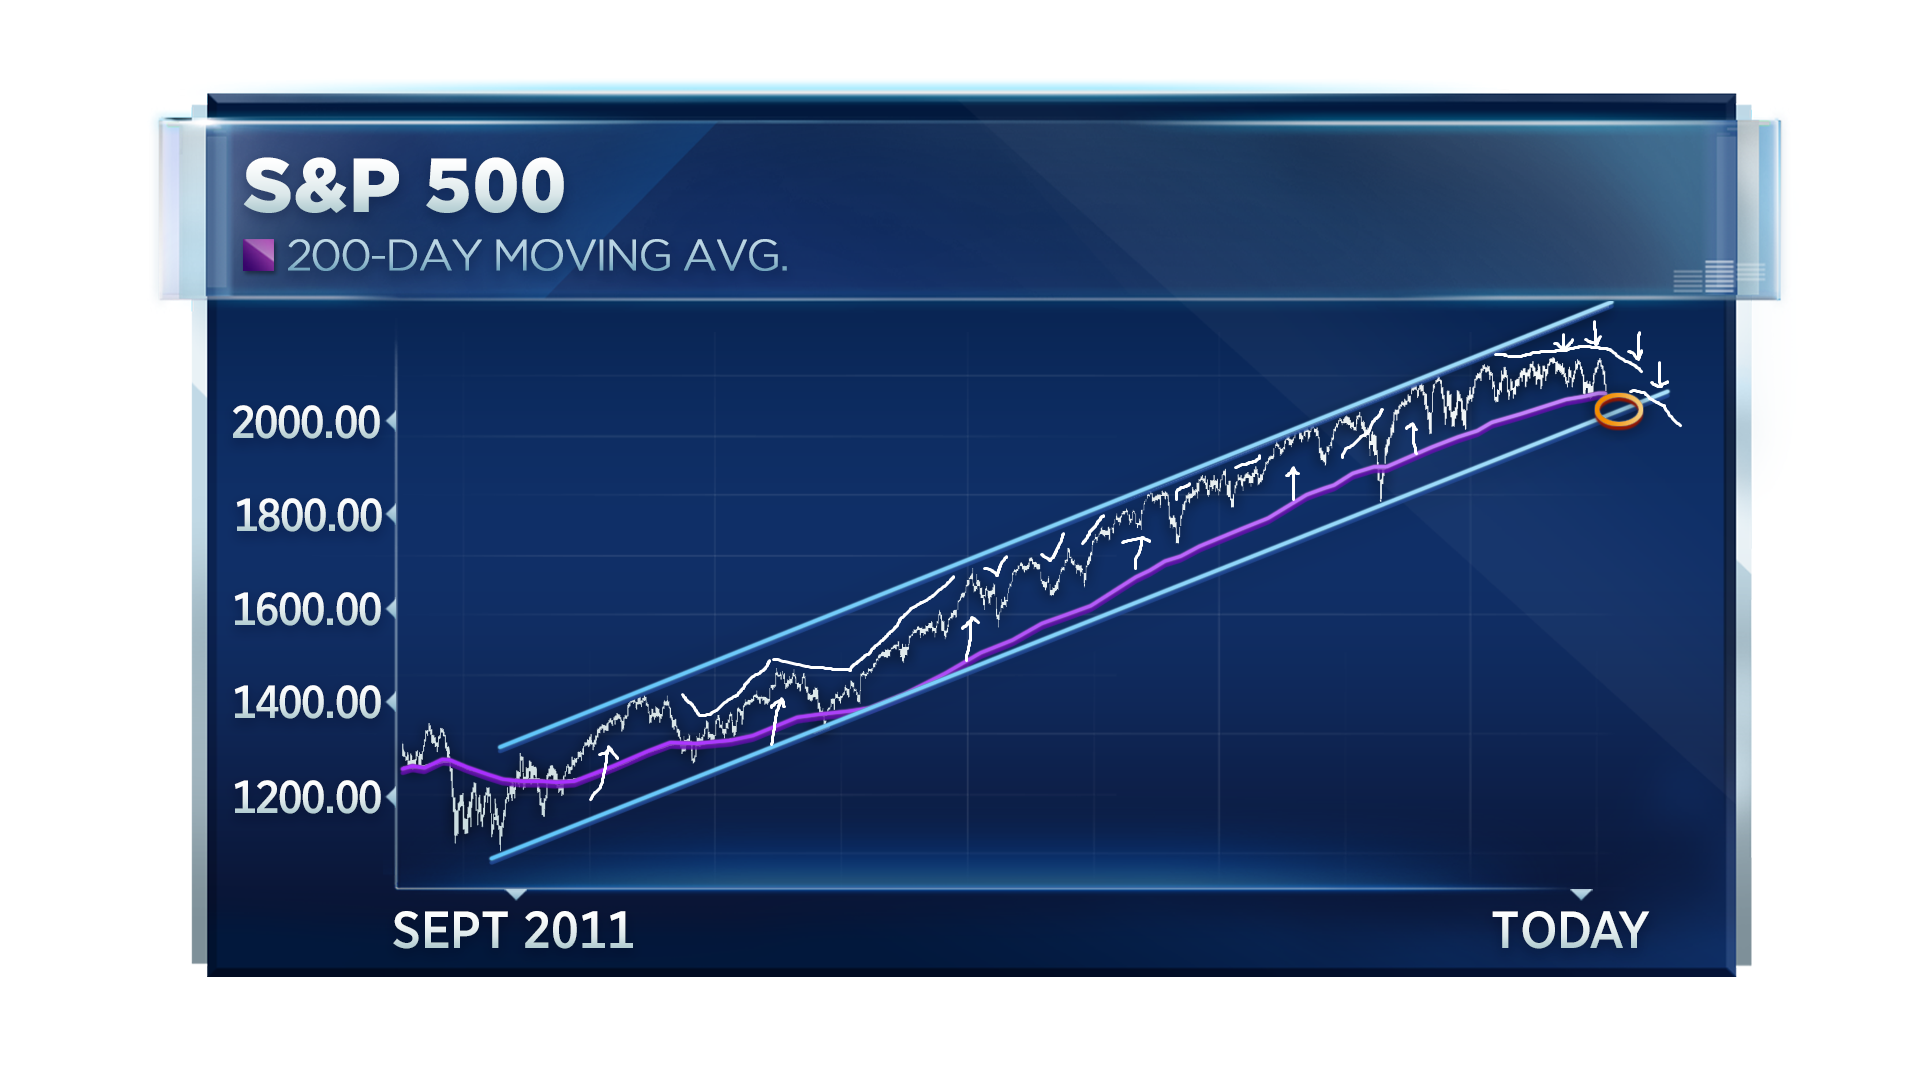
Please take note of my white arrows and lines I have drawn above. See how over the last few years the upper band always touches or comes close to touching the upper line in a constant ascension? Each time, the upper band stayed in line with the upper line Notice now how it's beginning to peel away/ make a right rounding turn away in tight banding from the upper line? This is exactly what it did in 2008 as well. This bounce from the 200 day needs to clear the upper pivot convincingly. It looks to me that it will not so please be careful!
$BDSI Chart:
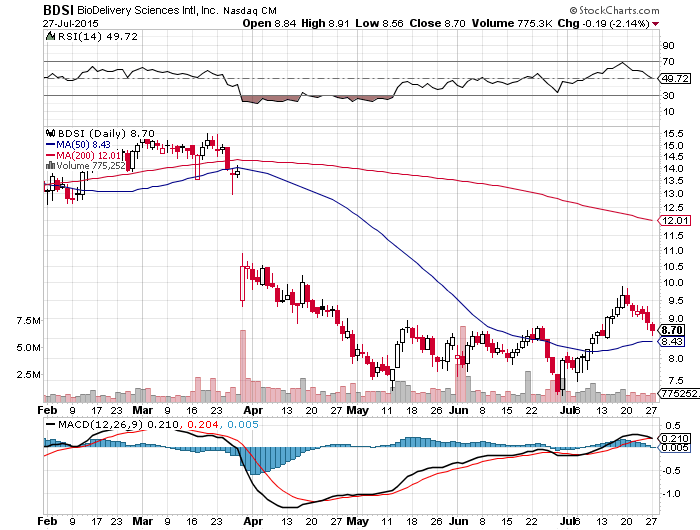
$BDSI is rather self-explanatory. We can see that a move to $8.43 would signal either a smoking buy, or a potential much lower price if $8.43 was breached on heavy volume. That is the key for BDSI -- heavy volume. As of now, $8.70 is very strong support as it's the former area of resistance. Could be a decent trade today so keep a close eye on it!
$RLYP Chart:
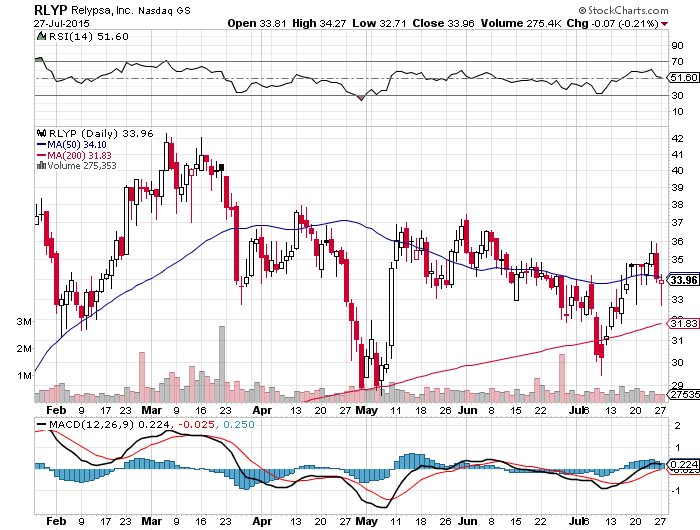
This chart constrinates me. One one hand, it looks like we can get a strong bounce-back today as a reversal candle was made yesterday. On the other hand, it looks like the bounce-back would be short lived. A move back to $35 is possible today, but we would need a CLOSE over $35 to reestablish the channel and to make a move to bust the heavy resistance at $36. This one has catalysts upcoming in October, and if market conditions are ok by then, we could see a nice run-up here. However, this will be the big question; "will the $IBB correct or not, and if so, how low, and how high will the bounce back be?"
$JUNO Chart:
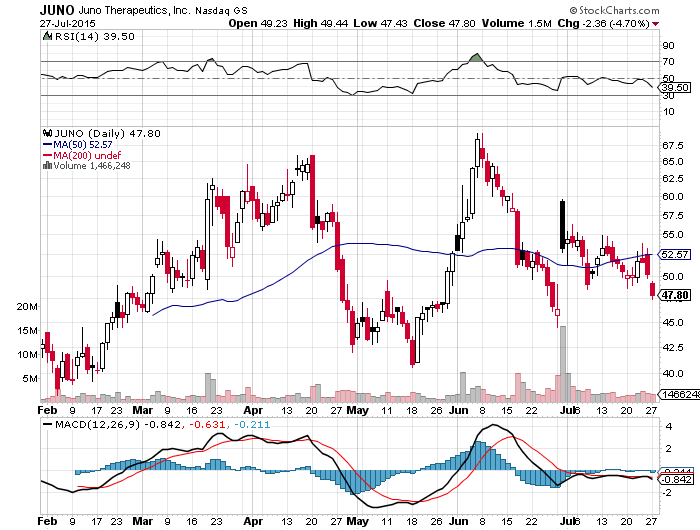
$JUNO will go as the $IBB goes for the most part. $CELG has a big stake in this company via shares bought much higher. Therefore, when markets turn south, CELG likely short hedges to protect their long position. I do like this one's potential but the same question about the IBB applies here -- obviously!
")